
Day 10: Probability and Statistics - Basic Concepts, Relevant Distributions - Expanded#
Objective#
Deepen your mastery of probability and statistics, crucial for analyzing data and making data-driven decisions. This lesson provides a thorough exploration of the core concepts, various distributions, and practical applications using Python, equipping you with the skills to perform detailed statistical analysis and understand data distributions.
Prerequisites#
Proficient in Python programming.
Basic understanding of algebra and mathematical concepts.
A keen interest in data analysis and interpretation.
Introduction to Probability and Statistics#
Probability and statistics are interrelated disciplines that help us quantify uncertainty, analyze random phenomena, and make sense of data.
Probability: The Mathematics of Uncertainty#
Probability offers a framework for quantifying the uncertainty of events. It’s foundational for statistical inference, where we use data to make predictions about broader populations.
Random Experiment: An experiment where the outcome cannot be predicted with certainty.
Sample Space (S): The set of all possible outcomes of a random experiment.
Event (E): Any subset of the sample space.
Probability of an Event (P(E)): A measure ranging from 0 (impossibility) to 1 (certainty), denoting the likelihood of occurrence of an event.
Statistics: The Science of Data#
Statistics is the practice of collecting, analyzing, interpreting, and presenting data. It’s about extracting meaning from data and making informed decisions.
Descriptive Statistics: Methods for summarizing and organizing data. Includes measures like mean, median, mode, variance, and standard deviation.
Inferential Statistics: Techniques for making predictions or inferences about a population based on a sample. It includes hypothesis testing, confidence intervals, and regression analysis.
Understanding Distributions#
Distributions are fundamental in statistics as they describe how data points are likely to be distributed.
Uniform Distribution: The simplest probability distribution where every event has an equal chance of occurring.
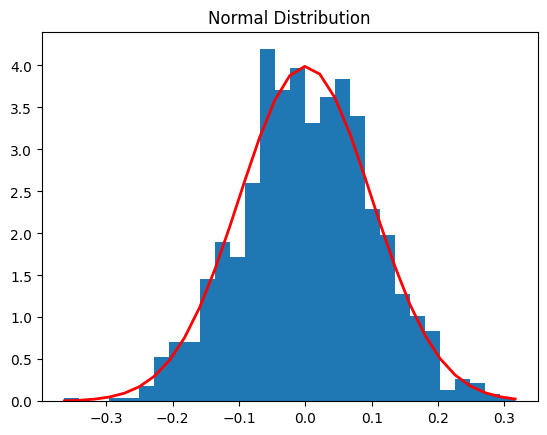
Normal (Gaussian) Distribution: Many natural phenomena follow this distribution. It’s characterized by its mean (μ) and standard deviation (σ).
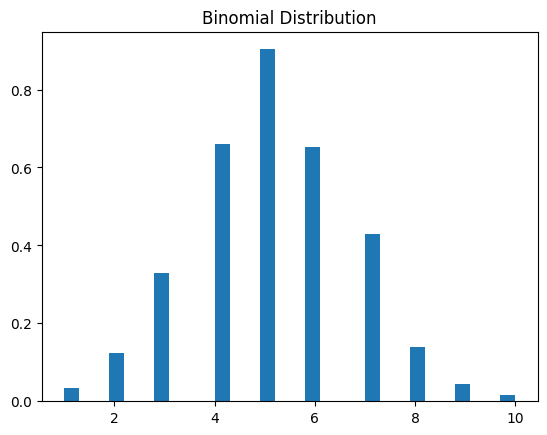
Binomial Distribution: Describes the number of successes in a fixed number of independent Bernoulli trials, each with its own success probability.
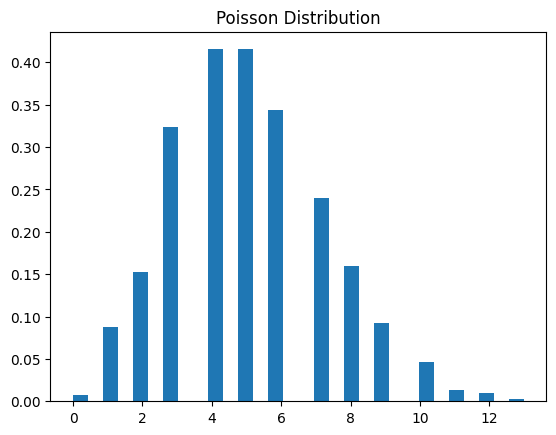
Poisson Distribution: Models the number of times an event occurs in a fixed interval of time or space, given the average number of times the event occurs over that interval
Implementing Probability and Statistics in Python#
Let’s dive into practical implementation using Python’s powerful libraries.
Step 1: Import Necessary Libraries#
import numpy as np
import scipy.stats as stats
import pandas as pd
import matplotlib.pyplot as plt
Step 2: Descriptive Statistics#
Understanding the central tendency and dispersion in your data.
# Sample data
data = np.array([1, 2, 3, 4, 5, 6, 7, 8, 9, 10])

# Central Tendency
mean = np.mean(data)
median = np.median(data)
mode = stats.mode(data)[0]

# Dispersion
range_ = np.ptp(data)
variance = np.var(data)
std_dev = np.std(data)

print(f"Mean: {mean}, Median: {median}, Mode: {mode}, Range: {range_}, Variance: {variance}, Standard Deviation: {std_dev}")
Mean: 5.5, Median: 5.5, Mode: 1, Range: 9, Variance: 8.25, Standard Deviation: 2.8722813232690143
Step 3: Understanding Distributions#
Visualize and understand different probability distributions.
Normal Distribution Example
# Parameters
mu, sigma = 0, 0.1

# Generating random values
s = np.random.normal(mu, sigma, 1000)

# Plotting
count, bins, ignored = plt.hist(s, 30, density=True)
plt.plot(bins, 1/(sigma * np.sqrt(2 * np.pi)) * np.exp( - (bins - mu)**2 / (2 * sigma**2) ), linewidth=2, color='r')
plt.title('Normal Distribution')
plt.show()
Binomial Distribution Example
# Parameters
n, p = 10, 0.5

# Generating random values
s = np.random.binomial(n, p, 1000)

# Plotting
plt.hist(s, bins=30, density=True)
plt.title('Binomial Distribution')
plt.show()
Poisson Distribution Example
# Parameters
lambda_ = 5

# Generating random values
s = np.random.poisson(lambda_, 1000)

# Plotting
plt.hist(s, bins=30, density=True)
plt.title('Poisson Distribution')
plt.show()
Step 4: Inferential Statistics#
Inferential statistics help us make predictions about a population based on sample data.
# Hypothesis Testing Example
# Null Hypothesis: The sample comes from a population with a mean of μ_0
# Alternative Hypothesis: The sample does not come from a population with a mean of μ_0

# Parameters
mu_0 = 5
alpha = 0.05  # Significance level

# T-test
t_statistic, p_value = stats.ttest_1samp(data, mu_0)

print(f"T-statistic: {t_statistic}, P-value: {p_value}")
print("Reject Null Hypothesis" if p_value < alpha else "Fail to Reject Null Hypothesis")
T-statistic: 0.5222329678670935, P-value: 0.614117254808394
Fail to Reject Null Hypothesis
Conclusion#
Probability and statistics are indispensable in the field of data analysis and decision-making. This lesson provided a deep dive into the core concepts, distributions, and practical Python implementations, laying the groundwork for rigorous data analysis and interpretation.
Further Resources#
https://www.khanacademy.org/math/statistics-probability
https://www.probabilitycourse.com/preface.php
https://www.vfu.bg/en/e-Learning/Math–Bertsekas_Tsitsiklis_Introduction_to_probability.pdf
https://www.youtube.com/watch?v=1uW3qMFA9Ho&list=PLUl4u3cNGP60hI9ATjSFgLZpbNJ7myAg6
https://morningside.libguides.com/math-stats-resources/probability-statistics